I have watched football since I was a little kid. Around 25 years ago, in what can only be described as a moment of pure childhood genius, tiny me looked at all the football teams in existence and thought, “You know what would be fun? Supporting Leeds United!” Oh boy, have they delivered. Leeds have ruined more Saturday afternoons than I ever thought possible, leaving me questioning life choices and the meaning of loyalty.
Anyway, changing your football team is basically a crime, so I have to find other ways to cope. That’s why, to cheer myself up, I like to dive into the stats. But what’s even better is to analyze the data yourself. So when I found out that StatsBomb provide some free data, I had to check it out. In this blog series we will explore how to navigate through the StatsBomb files and create a simple Qlik Sense dashboard like the one below using only out-of-the box features. Trust me, this is much more fun than watching Patrick Bamford missing a sitter. As is tradition.
Accessing and loading StatsBomb data
StatsBomb offers free data on their GitHub repository, provided in JSON format. Luckily, JSON files are now supported in Qlik Sense so let’s load the key datasets: Competitions, Matches, and Events.
Competitions
To start, download competitions.json from StatsBomb’s repository and load it into Qlik Sense. Note that in this example the file is located in the Development space in a folder called StatsBomb.
Competitions:
LOAD
    competition_id,
    season_id,
    country_name,
    competition_name,
    season_name
FROM [lib://Development:DataFiles/StatsBomb/competitions.json] (json);
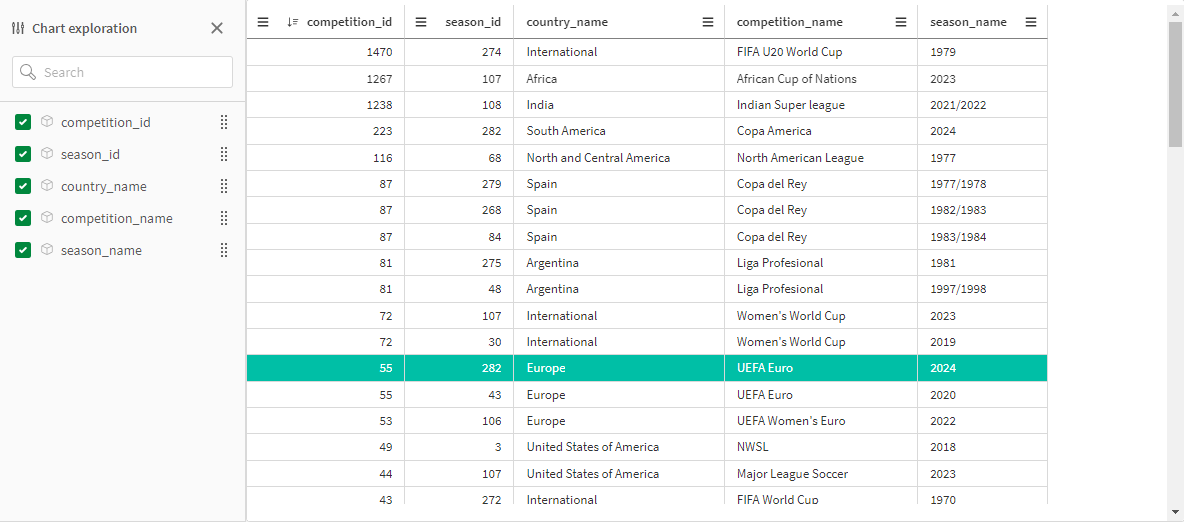
This file gives us a list of competitions with useful IDs. For example, if you want data from Euro 2024, look up competition_id (55) and season_id (282).

Matches
Now, with the competition_id and season_id, we can access match data. Navigate to data/matches/55/282.json in the repository. This gives you a match-by-match breakdown for your chosen competition. Download the file and load it into Qlik Sense:
Matches:
LOAD
    match_id,
    match_date,
    home_team.home_team_name,
    away_team.away_team_name,
    competition_stage.name
FROM [lib://Development:DataFiles/StatsBomb/282.json] (json);
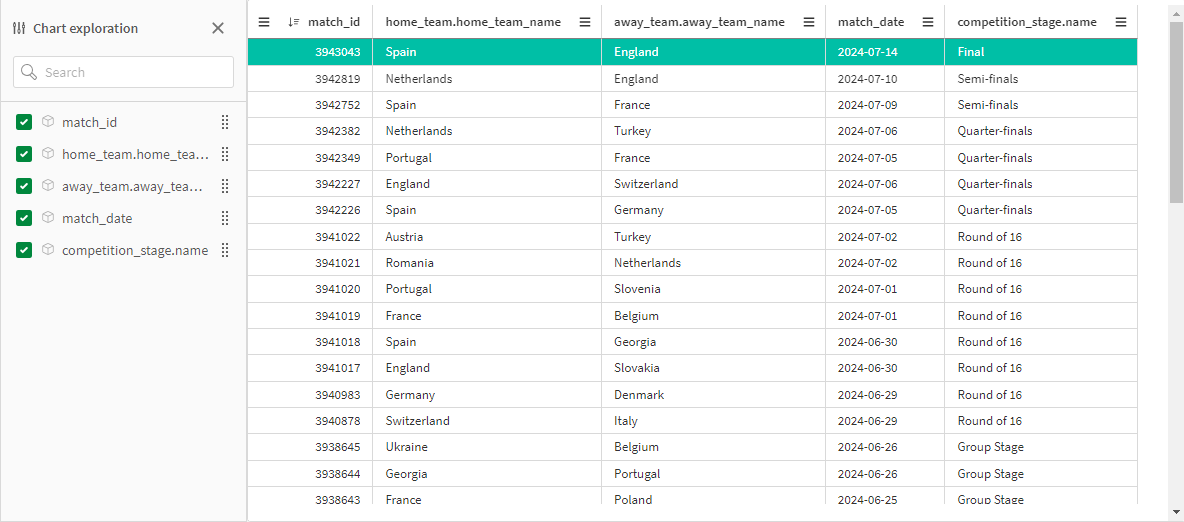
Identify a match_id for the specific game you want, say the Euro 2024 final, where the ID is 3943043. Now, we’re ready to dive into event-level data.

Events
With the match_id in hand, go to data/events/3943043.json to get granular details on each event (shots, passes, etc.) in the match. The JSON file contains a large number of fields, but for simplicity, we will only load the data we need. If you want to explore each field in detail, the documentation on StatsBomb’s GitHub page provides a comprehensive explanation of the available fields. Load the data as follows:
Events:
LOAD
    id AS Event_ID,
    type.name AS Type_Name,
    player.name AS Player_Name,
    location.0 AS Location_X,
    location.1 AS Location_Y,
    pass.end_location.0 AS Pass_End_Location_X,
    pass.end_location.1 AS Pass_End_Location_Y,
    shot.outcome.name AS Shot_Outcome_Name
FROM [lib://Development:DataFiles/StatsBomb/3943043.json] (json);
Pay attention to the way location and pass.end_location are loaded by extracting values from arrays. This technique ensures that the data is not loaded as subtables, making it easier to work with in your visualizations.
Enriching the data
As it is often the case, we need more data than what we have readily available. To create a heat map of each player’s activity, we need to specify which events to include. Let’s set up a mapping table for the relevant events:
Heat_Map:
MAPPING LOAD * INLINE [
    Event,Status
    Carry,Yes
    Pressure,Yes
    Dribble,Yes
    Shot,Yes
    Duel,Yes
    Foul Won,Yes
    Block,Yes
    Goal Keeper,Yes
    Dribbled Past,Yes
    Ball Recovery,Yes
    Ball Receipt*,Yes
    Miscontrol,Yes
    Dispossessed,Yes
    Foul Committed,Yes
    Clearance,Yes
    Shield,Yes
    50/50,Yes
    Interception,Yes
    Pass,Yes
    Offside,Yes
    Error,Yes
] (DELIMITER IS ',');
As always, make sure to place the mapping table at the beginning of your script. Now, let’s apply the mapping to add a new field in the Events table. We will also create two additional fields – Shot_Map and Pass_Map – to track these specific event types.
Events:
LOAD
    id AS Event_ID,
    type.name AS Type_Name,
    APPLYMAP('Heat_Map', type.name, 'No') AS Heat_Map,
    IF(MATCH(type.name, 'Shot'), 'Yes', 'No') AS Shot_Map,
    IF(MATCH(type.name, 'Pass'), 'Yes', 'No') AS Pass_Map,
    player.name AS Player_Name,
    location.0 AS Location_X,
    location.1 AS Location_Y,
    pass.end_location.0 AS Pass_End_Location_X,
    pass.end_location.1 AS Pass_End_Location_Y,
    shot.outcome.name AS Shot_Outcome_Name
FROM [lib://Development:DataFiles/StatsBomb/3943043.json] (json);
For this example, we also want to add pictures of the players and we will get them from the UEFA website. I hope they are happy with the mountains of cash they have made from their totally legitimate business activities and completely transparent financial dealings and won’t go after me for copyright infringement. Let’s add a new table:
Pictures:
LOAD
RECNO() AS ID,
Player_Name,
URL
INLINE [
    Player_Name,URL
    Álvaro Borja Morata Martín,https://img.uefa.com/imgml/TP/players/3/2024/cutoff/250024456.png
    Aymeric Laporte,https://img.uefa.com/imgml/TP/players/3/2024/cutoff/250027046.png
    Daniel Carvajal Ramos,https://img.uefa.com/imgml/TP/players/3/2024/cutoff/250024448.png
    Daniel Olmo Carvajal,https://img.uefa.com/imgml/TP/players/3/2024/cutoff/250081720.png
    Fabián Ruiz Peña,https://img.uefa.com/imgml/TP/players/3/2024/cutoff/250115436.png
    José Ignacio Fernández Iglesias,https://img.uefa.com/imgml/TP/players/3/2024/cutoff/1900122.png
    Lamine Yamal Nasraoui Ebana,https://img.uefa.com/imgml/TP/players/3/2024/cutoff/250176450.png
    Marc Cucurella Saseta,https://img.uefa.com/imgml/TP/players/3/2024/cutoff/250076168.png
    Martín Zubimendi Ibáñez,https://img.uefa.com/imgml/TP/players/3/2024/cutoff/250143679.png
    Mikel Merino Zazón,https://img.uefa.com/imgml/TP/players/3/2024/cutoff/250080572.png
    Mikel Oyarzabal Ugarte,https://img.uefa.com/imgml/TP/players/3/2024/cutoff/250097180.png
    Nicholas Williams Arthuer,https://img.uefa.com/imgml/TP/players/3/2024/cutoff/250163185.png
    Robin Aime Robert Le Normand,https://img.uefa.com/imgml/TP/players/3/2024/cutoff/250112513.png
    Rodrigo Hernández Cascante,https://img.uefa.com/imgml/TP/players/3/2024/cutoff/250082664.png
    Unai Simón Mendibil,https://img.uefa.com/imgml/TP/players/3/2024/cutoff/250076116.png
    Bukayo Saka,https://img.uefa.com/imgml/TP/players/3/2024/cutoff/250106939.png
    Cole Palmer,https://img.uefa.com/imgml/TP/players/3/2024/cutoff/250124282.png
    Declan Rice,https://img.uefa.com/imgml/TP/players/3/2024/cutoff/250083732.png
    Harry Kane,https://img.uefa.com/imgml/TP/players/3/2024/cutoff/250016833.png
    Ivan Toney,https://img.uefa.com/imgml/TP/players/3/2024/cutoff/250178523.png
    John Stones,https://img.uefa.com/imgml/TP/players/3/2024/cutoff/250064233.png
    Jordan Pickford,https://img.uefa.com/imgml/TP/players/3/2024/cutoff/250024791.png
    Jude Bellingham,https://img.uefa.com/imgml/TP/players/3/2024/cutoff/250128377.png
    Kobbie Mainoo,https://img.uefa.com/imgml/TP/players/3/2024/cutoff/250165175.png
    Kyle Walker,https://img.uefa.com/imgml/TP/players/3/2024/cutoff/250010259.png
    Luke Shaw,https://img.uefa.com/imgml/TP/players/3/2024/cutoff/250042705.png
    Marc Guehi,https://img.uefa.com/imgml/TP/players/3/2024/cutoff/250086928.png
    Ollie Watkins,https://img.uefa.com/imgml/TP/players/3/2024/cutoff/250150887.png
    Phil Foden,https://img.uefa.com/imgml/TP/players/3/2024/cutoff/250101534.png
] (DELIMITER IS ',');
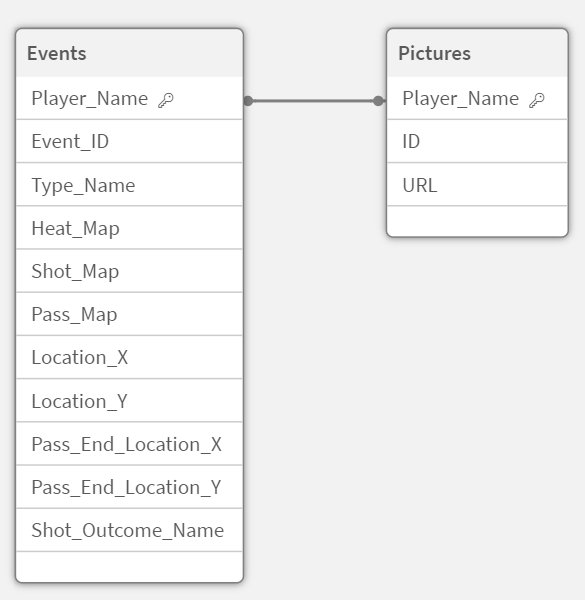
Since the Competitions and Matches tables are no longer needed, you can comment them out. This will leave you with a tidy data model:

Now that the data is ready, it is time to dive into the fun part – creating visualizations. In StatsBomb x Qlik Sense – Part 2: Dashboard Design we will focus on building the actual dashboard and bringing the data to life.
